Monitoring and alerts
Live and historical server metrics, and alert rules that fire on CPU, memory, disk, load, offline servers, failed services, websites and self-checks.
Every agent reports its server's health every 15 seconds. The panel keeps that history for charts, and the worker checks it against alert rules every 15 seconds. Alerts show in the top bar, on the server's page and in the audit log, and can be sent by email and to webhooks.
Monitoring
Monitoring > Monitoring shows the live health of every server: CPU, memory, the fullest disk, load, network in and out, services and firing alerts, with a trend for the last hour. Select a server for its charts, services and processes.
Each server's Overview tab has the full charts:
| Chart | Series |
|---|---|
| CPU and memory | CPU %, memory % |
| Load average | Load over 1 minute |
| Disk and swap | Disk % of /, swap % |
| Network | Bytes received and sent per second |
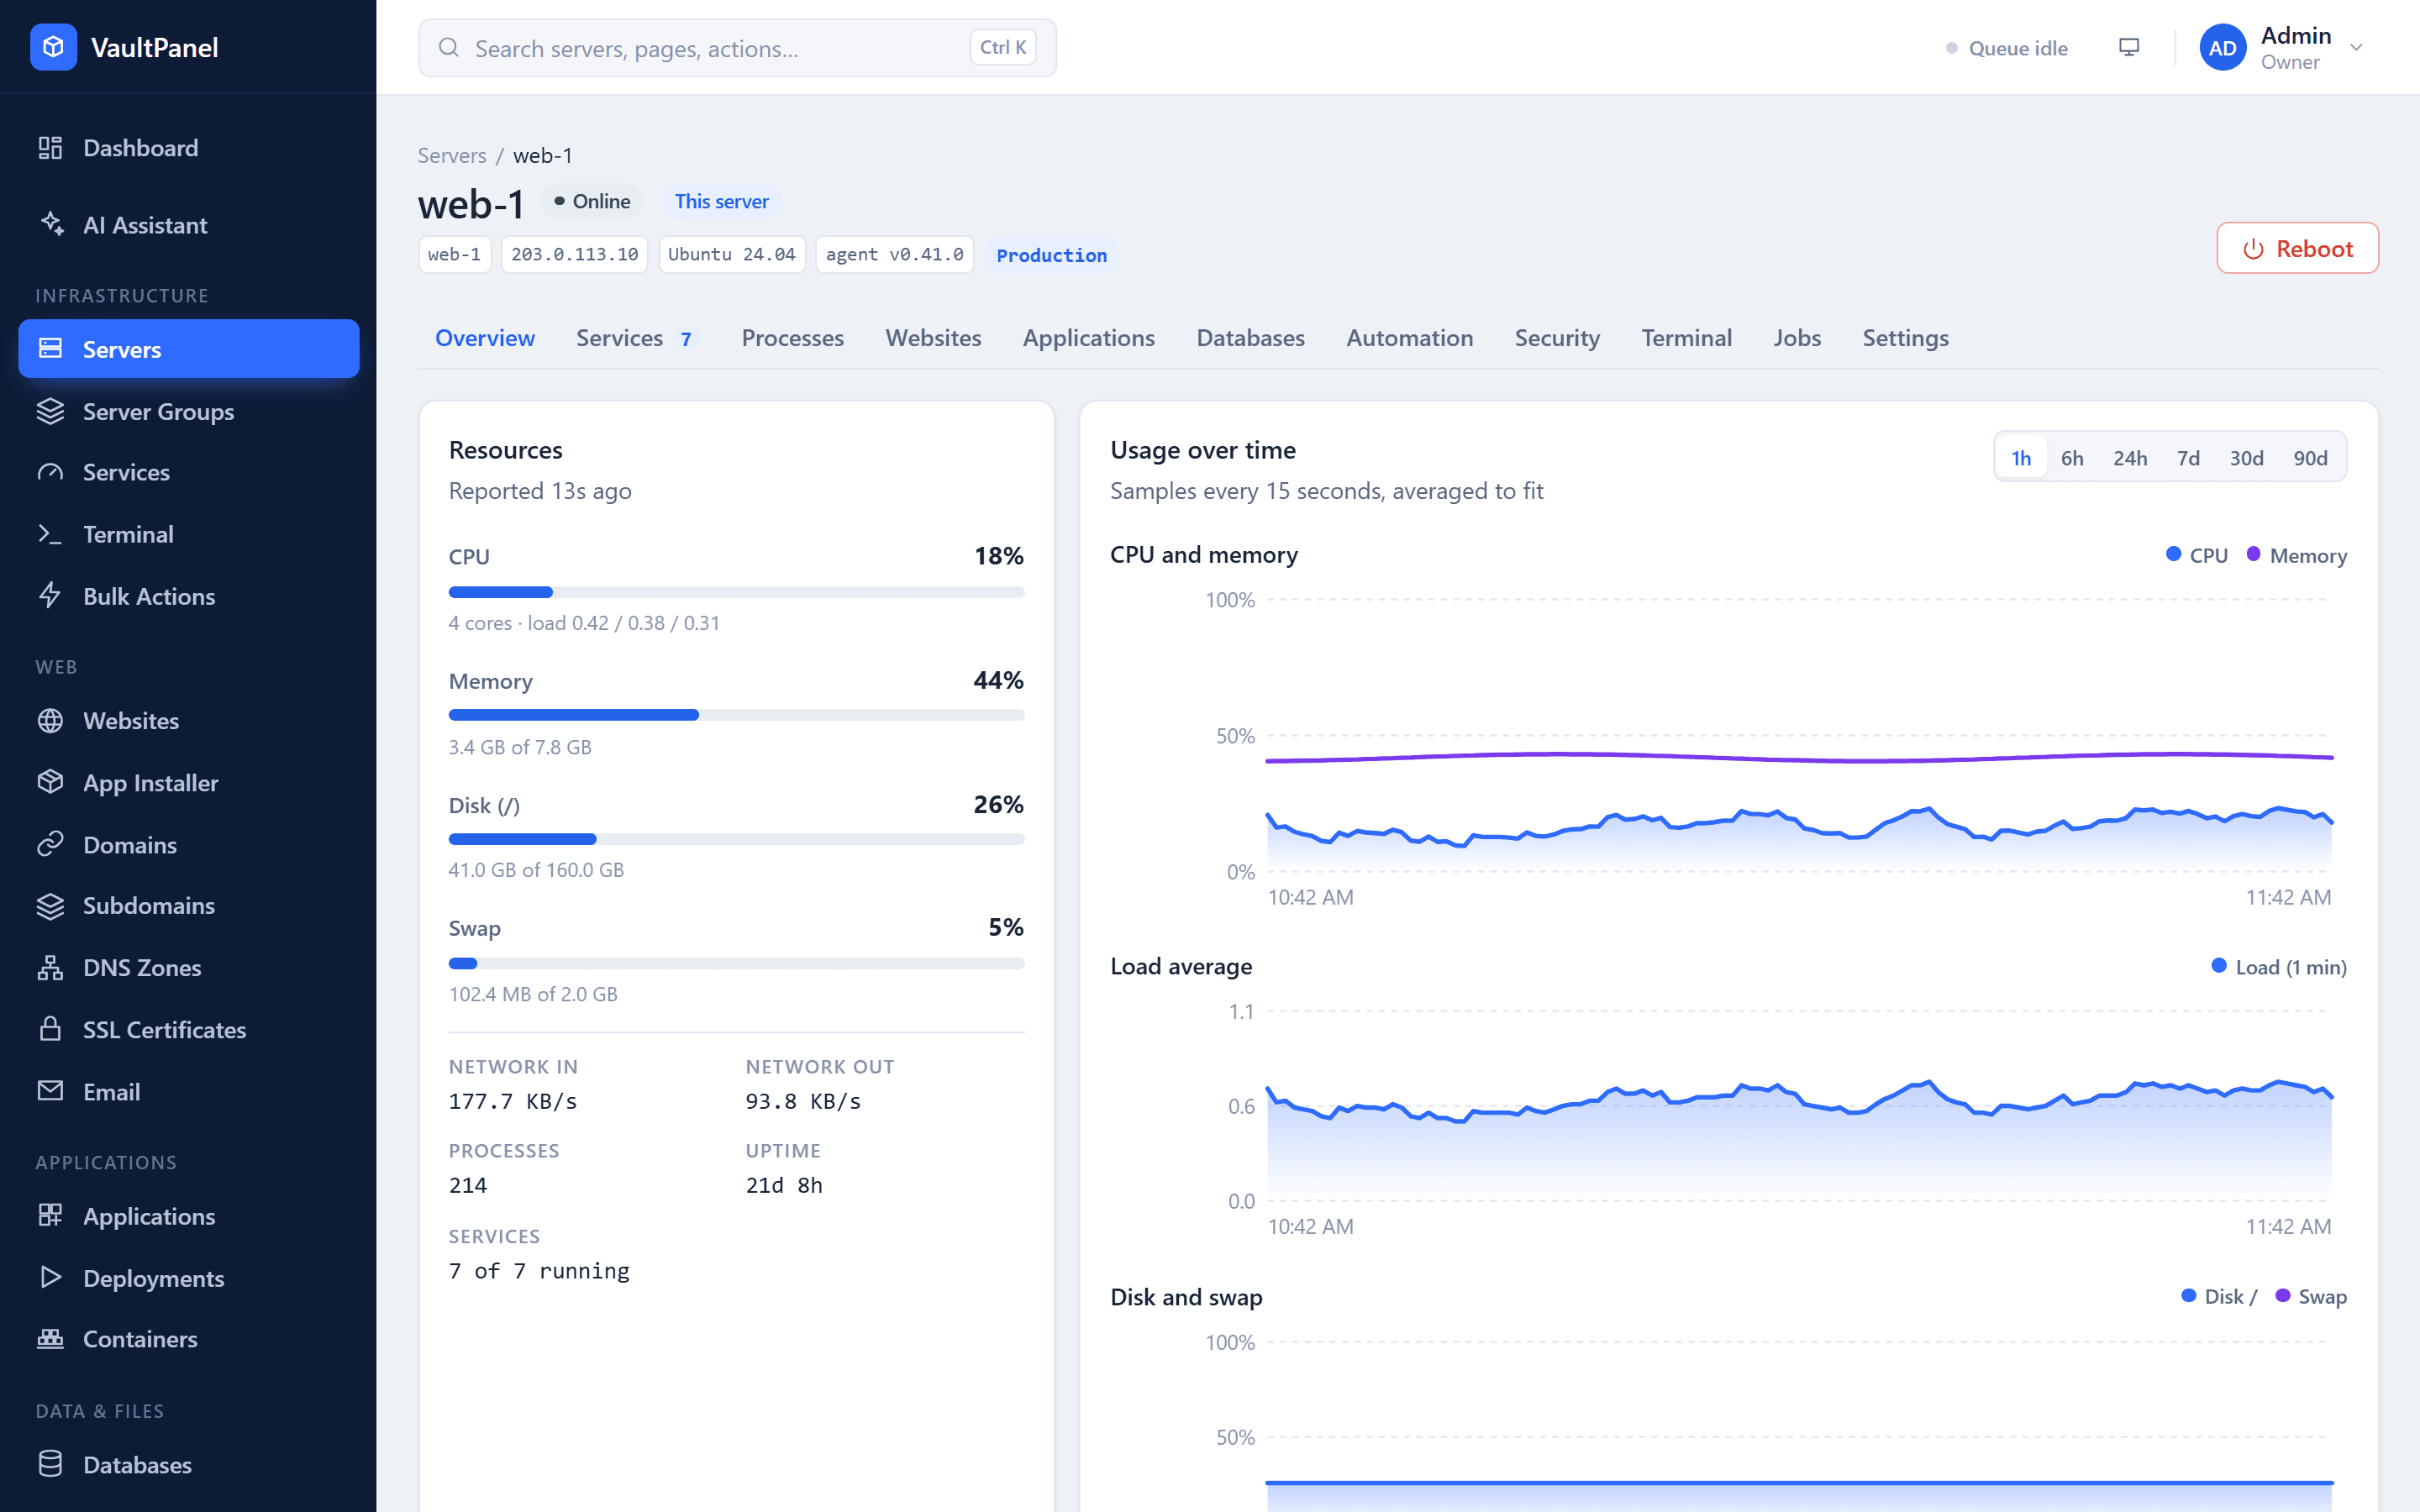
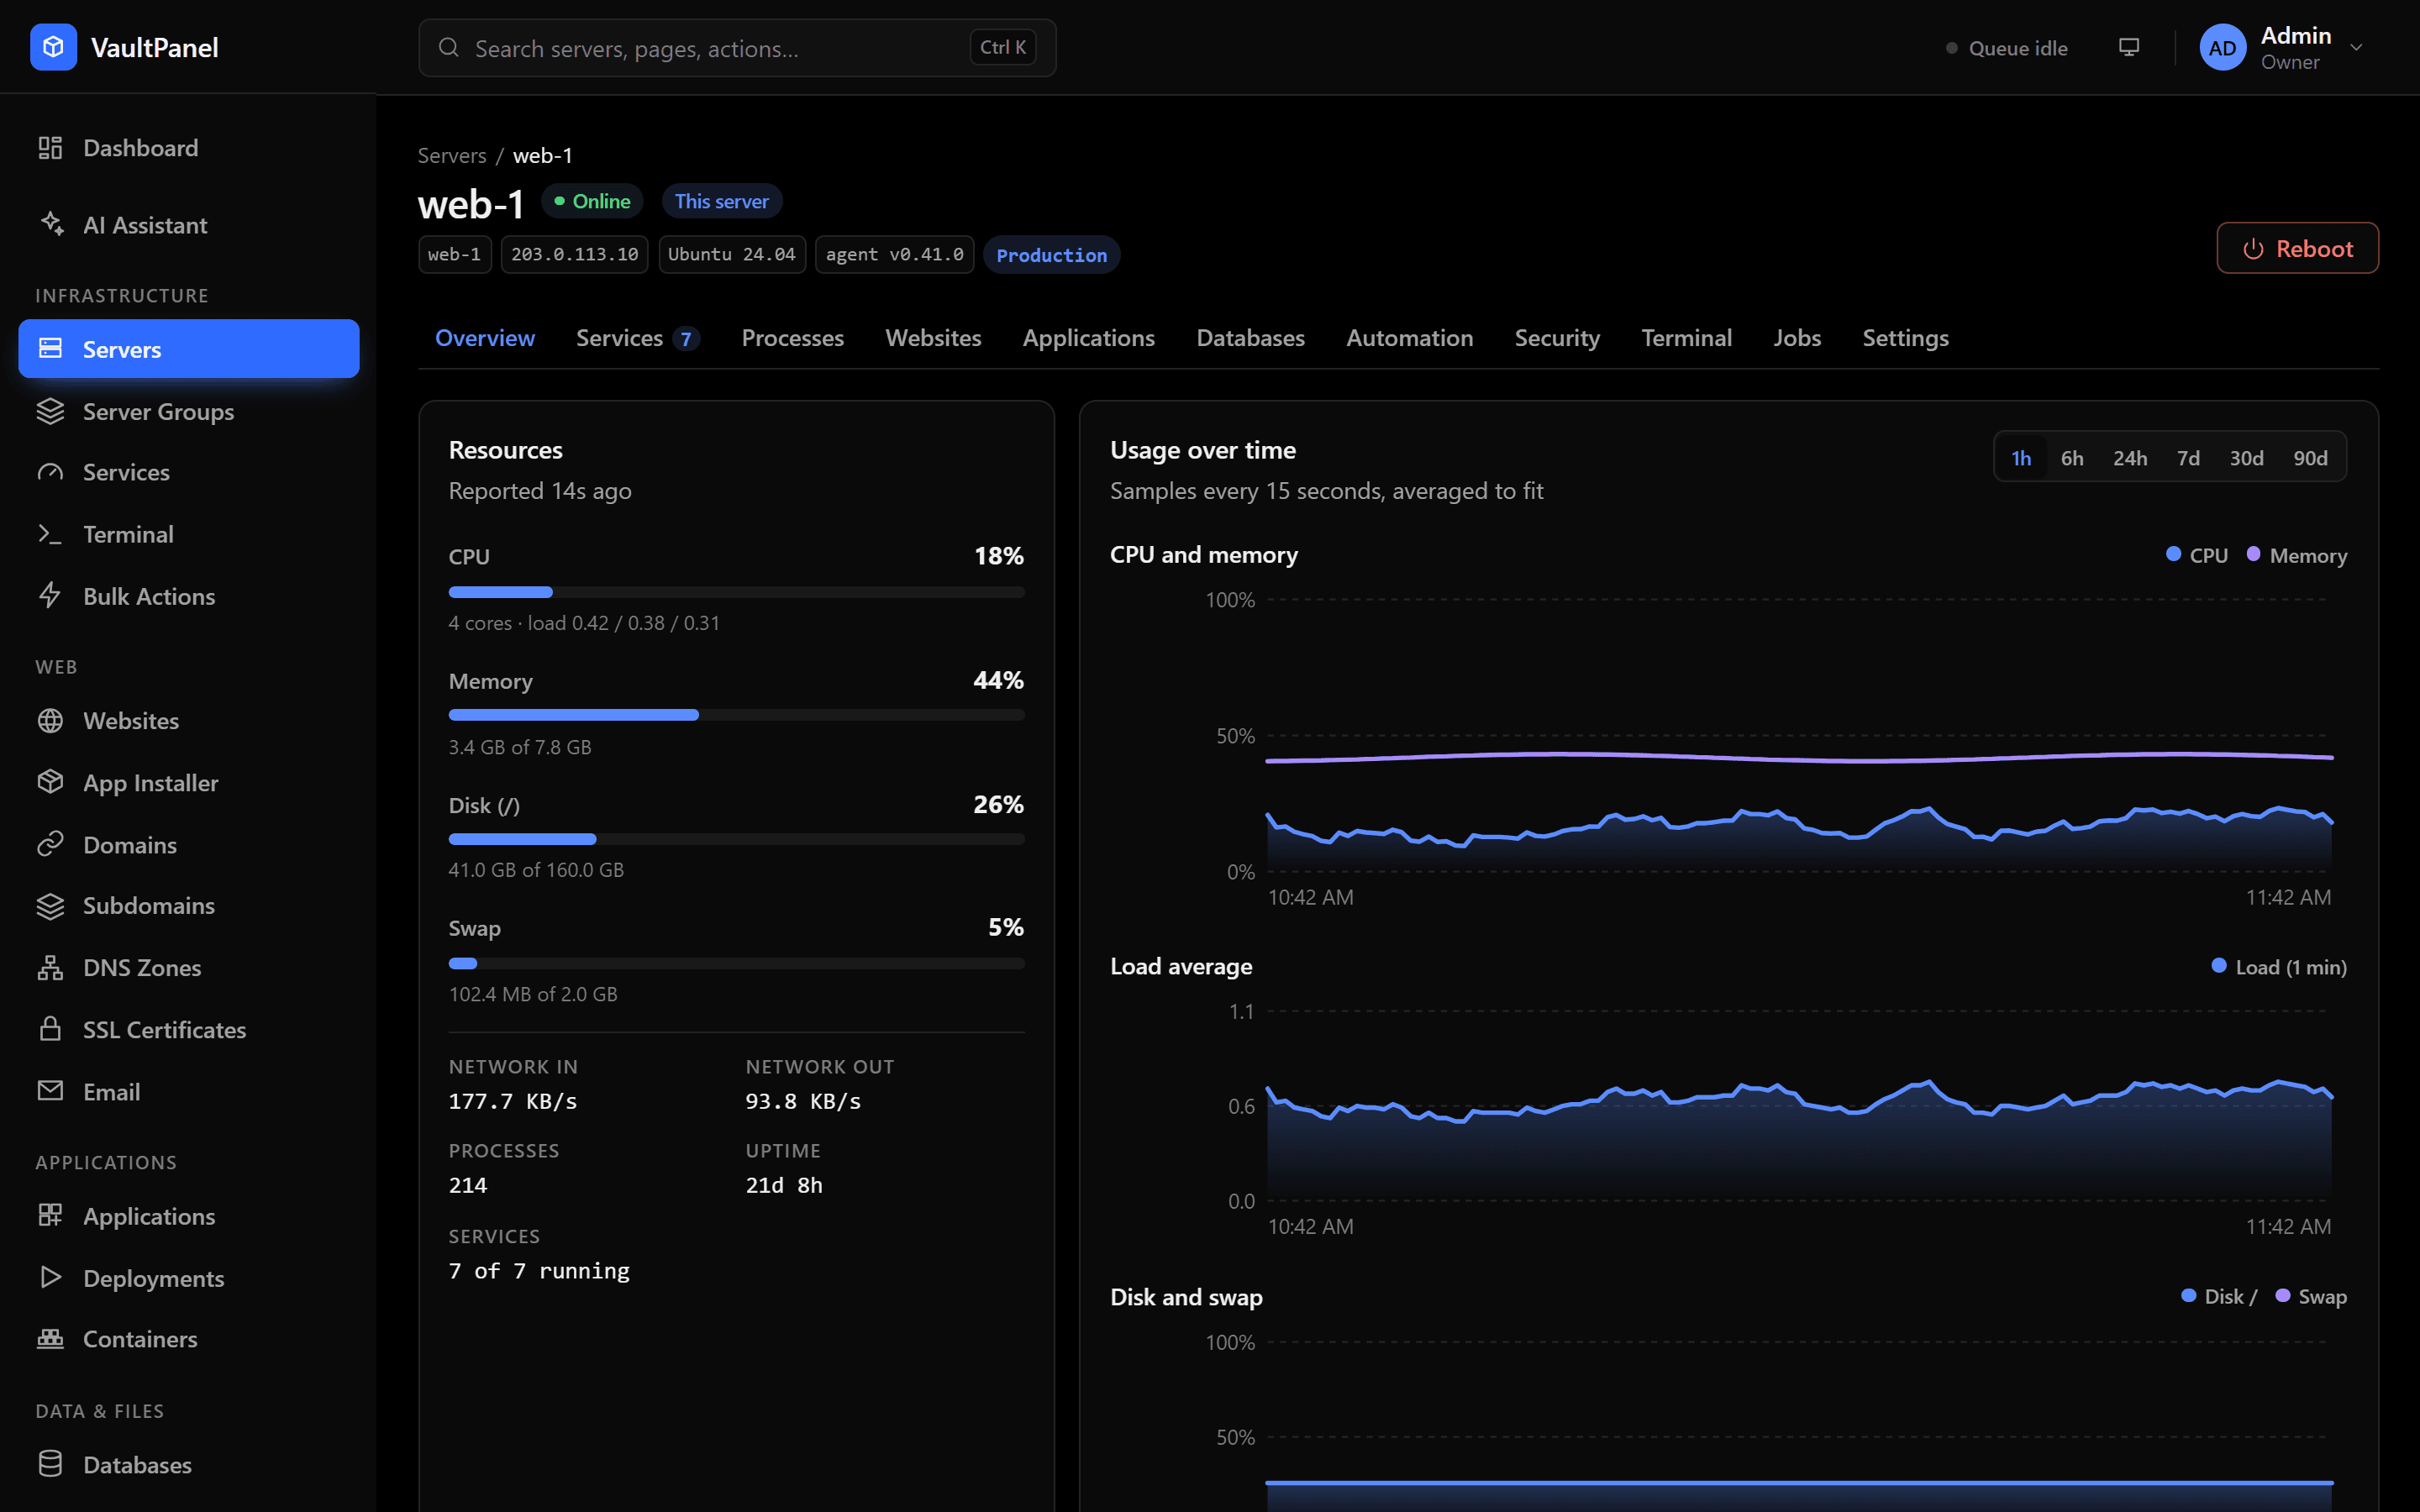
The Filesystems card shows every real mounted filesystem the agent found (up to 20, skipping /boot and snaps), with its usage.
Metrics and history
| Range | Source | Kept for |
|---|---|---|
| 1h, 6h, 24h | Raw samples, one every 15 seconds, averaged to fit the chart | 7 days (VAULTPANEL_METRICS_RETENTION_DAYS) |
| 7d, 30d, 90d | Hourly averages | 90 days (VAULTPANEL_METRICS_HOURLY_RETENTION_DAYS) |
The worker averages every completed hour of raw samples into the hourly table, so long ranges stay fast and are kept much longer than raw samples.
How alerts work
Alerts follow the same model as Prometheus rules:
- When a rule's condition becomes true on a server, an alert event starts as Pending.
- If the condition holds for the rule's whole duration, the event becomes Firing. This is recorded in the audit log as
alert.fire. - When the condition clears, a firing event becomes Resolved (
alert.resolve). A pending event whose condition clears is dropped without firing.
When a server sends no fresh data, metric and service rules are left as they are instead of being resolved. While a server is offline, only the Server offline rule is evaluated for it.
Each condition is tracked on its own. A disk rule fires separately for each filesystem that crosses the threshold, and a service rule for each failed service.
Alert rules
Open Monitoring > Alerts > Rules to see, add and change rules. Managing rules needs alerts.manage.
| Field | Values |
|---|---|
| Name | Up to 100 characters |
| Watch | What the rule checks (see below) |
| Threshold | For metric rules only, within the metric's range |
| Service | For Service down only: one unit name, or empty for any watched service |
| For at least | Immediately, 1, 5, 10, 15 or 30 minutes, or 1 hour |
| Severity | Warning or Critical |
| Servers | One server, or All servers, including ones added later |
What a rule can watch
| Watch | Fires when | Threshold |
|---|---|---|
| CPU usage | CPU % is at or above the threshold | 1 to 100 % |
| Memory usage | Memory % is at or above the threshold | 1 to 100 % |
| Disk usage | Usage of any mounted filesystem is at or above the threshold | 1 to 100 % |
| Swap usage | Swap % is at or above the threshold | 1 to 100 % |
| Load per CPU core | The 1-minute load divided by the number of cores is at or above the threshold (1 means every core is fully busy) | 0.1 to 100 |
| Server offline | The server is marked offline | None |
| Service down | A watched service has failed, or is stopped although it is enabled at boot | None |
| Website down | A website on the server fails the panel's uptime checks | None |
| Server self-check failed | One of the server's self-checks reports an error (agent 0.39.0 and newer) | None |
Default rules
A new panel starts with these rules, which you can change or delete:
| Rule | Watch | Threshold | For at least | Severity |
|---|---|---|---|---|
| High CPU usage | CPU usage | 90 % | 10 minutes | Warning |
| High memory usage | Memory usage | 90 % | 5 minutes | Warning |
| Disk almost full | Disk usage | 90 % | 1 minute | Critical |
| Server offline | Server offline | 1 minute | Critical | |
| Service down | Service down | 1 minute | Warning | |
| Website down | Website down | 1 minute | Critical | |
| Server self-check failed | Server self-check failed | 10 minutes | Warning |
Deleting a rule resolves its open alerts at once. Past alerts stay in the history.
Firing alerts
Monitoring > Alerts has four tabs: Firing, Pending, History and Rules. Firing alerts also show:
- in the top bar of every page,
- at the top of the server's Overview tab,
- in the audit log, as
alert.fireandalert.resolve.
With alerts.acknowledge, click Acknowledge on a firing alert to show the team someone is on it. Only firing, unacknowledged alerts can be acknowledged. Resolved alerts are kept for 90 days (VAULTPANEL_ALERT_HISTORY_DAYS).
Notifications
Alerts reach people outside the panel in two ways:
- Email: with panel email set up, the panel emails owners and admins, and any extra addresses you list, when an alert starts firing. Its default events also include servers going offline.
- Webhooks: a webhook can subscribe to
alert.firing,alert.resolved,server.offlineandserver.online, as signed JSON or as Slack or Discord messages.
Troubleshooting
An alert that never fires usually means the condition did not hold for the rule's whole duration, or the server had no fresh telemetry. Rules are evaluated by the panel's worker, so it must be running (vaultpanel status on an installed panel shows it).